Pitfalls of migration from legacy infrastructure, or how to explain to the devs what case-sensitive is?
Contents
Legacy infrastructure refers to outdated or any other existing infrastructure that may not be efficient enough, and it’s harder to manage or maintain it than more modern and advanced solutions. As a rule, the components of such systems are difficult to change, scale, and upgrade, and their maintenance at a particular stage is not very profitable. Combined, all this leads to migration needs for a more efficient and manageable environment.
Specifically, in our case, the starting stack was a web server from Microsoft – IIS running the Windows operating system, and applications were deployed on it manually. At the same time, the clients set the task of transferring the primary services to another platform in a short time and simplifying the process of scaling them. Of course, the migration involved ensuring the appropriate level of security for the new system and automating typical processes. However, a significant part of the services remained on legacy servers, with which effective interaction had to be established.
In general, the original plan was to build an easily accessible, easy-to-test, and scalable system based on microservices in Docker and automating the build, test, and deployment of applications (CI / CD) managed by Jenkins. The main service was implemented on AWS, and NGINX servers were utilized as a proxy.
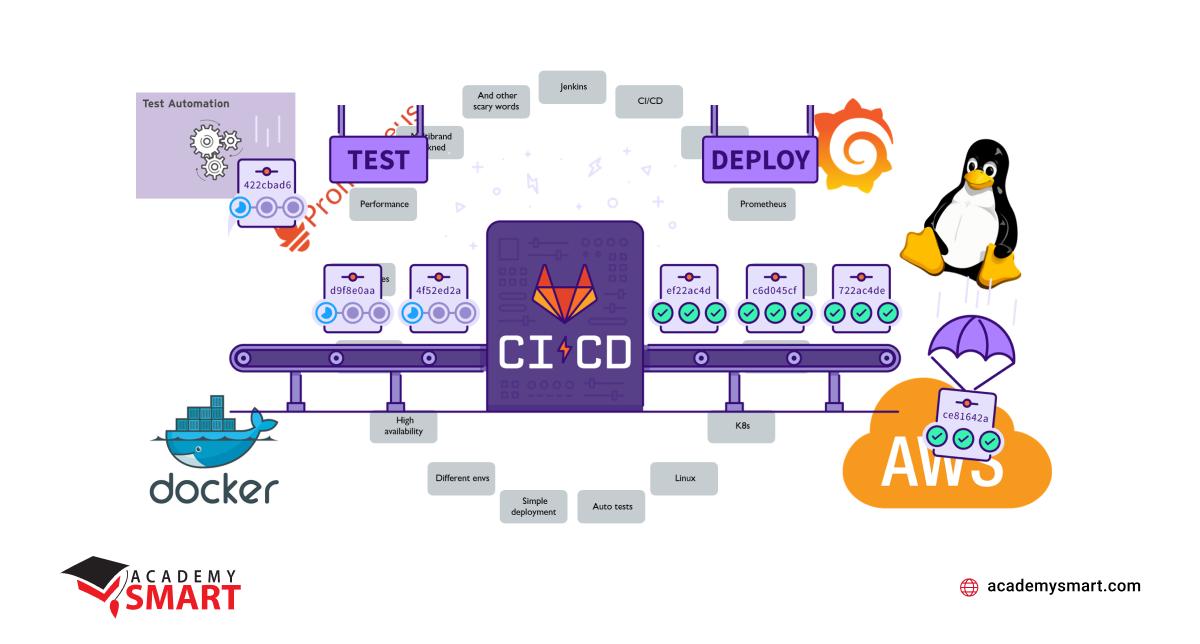
Our migration aims
However, gradual migration is a path that requires experimentation, endurance, and necessary compromises in addition to professional knowledge. Moreover, along the way, previously unforeseen circumstances and technical contradictions arise when combining various technical systems.
For example, when we deployed a test infrastructure based on Amazon Elastic Container Service, it turned out that it could only partially meet the needs of developers for flexible on-demand variable management. At this stage, we already had ten containers with different functionality and almost 45 variables for each. But updating them every time required a restart of the entire system as a whole, which was unacceptable. As a result, the original idea to use ECS had to be abandoned. That is how the decision to use the AWS Elastic Kubernetes Service came about, allowing us to more flexibly manage environment variables and settings and greatly simplifying the scaling of containers and applications. In addition, EKS enables us to manage services and orchestration in a more structured and convenient way using Kubernetes, regardless of the platform, which noticeably brought us closer to the goal.
In general, after a month, we built an efficient and highly available system, the security and stability of which were provided by CloudFlare, Firewall, and Fortinet Load Balancer cascade on virtual servers. We did not set up NGINX servers as a load balancer because we have a robust solution based on network hardware with the possibility of using it as a virtual balancing system. Everything worked fine regarding requests to services already hosted on the new infrastructure based on Docker containers, and in two years, we never needed to scale them up. Moreover, utilizing the Ansible toolkit for configuring NGINX virtual hosts, system settings, and even as a deployment solution of the containers, we created templates with the variables required, which we then used in Jenkins builds.
However, we had several noticeable troubles when requesting a part of the remaining services on the legacy environment. The primary root cause is to move management of the requests to legacy servers and communicate with them. To establish communication within the system, we made maps indicating the correspondence between the servers, their IP addresses, and host names. Then, we put them on the top of the configuration level.
Secondly, the transfer to a Linux system revealed a case-sensitivity problem. Previously, this difficulty did not arise on Windows since this system does not distinguish between file headers that begin with an uppercase or lowercase letter, treating them as the same file. On the contrary, Linux perceives them as two different files, so we faced the massive task of unifying the code of all our services to process them correctly. It is the case when direct interaction with the developers is critical to the project’s success since it was essential for us to get them to accept the new rules of the game, taking into account the change in hardware parameters and the implementation of new technical environments, like Docker. In general, some of our time on their training paid off in the future with a vengeance.
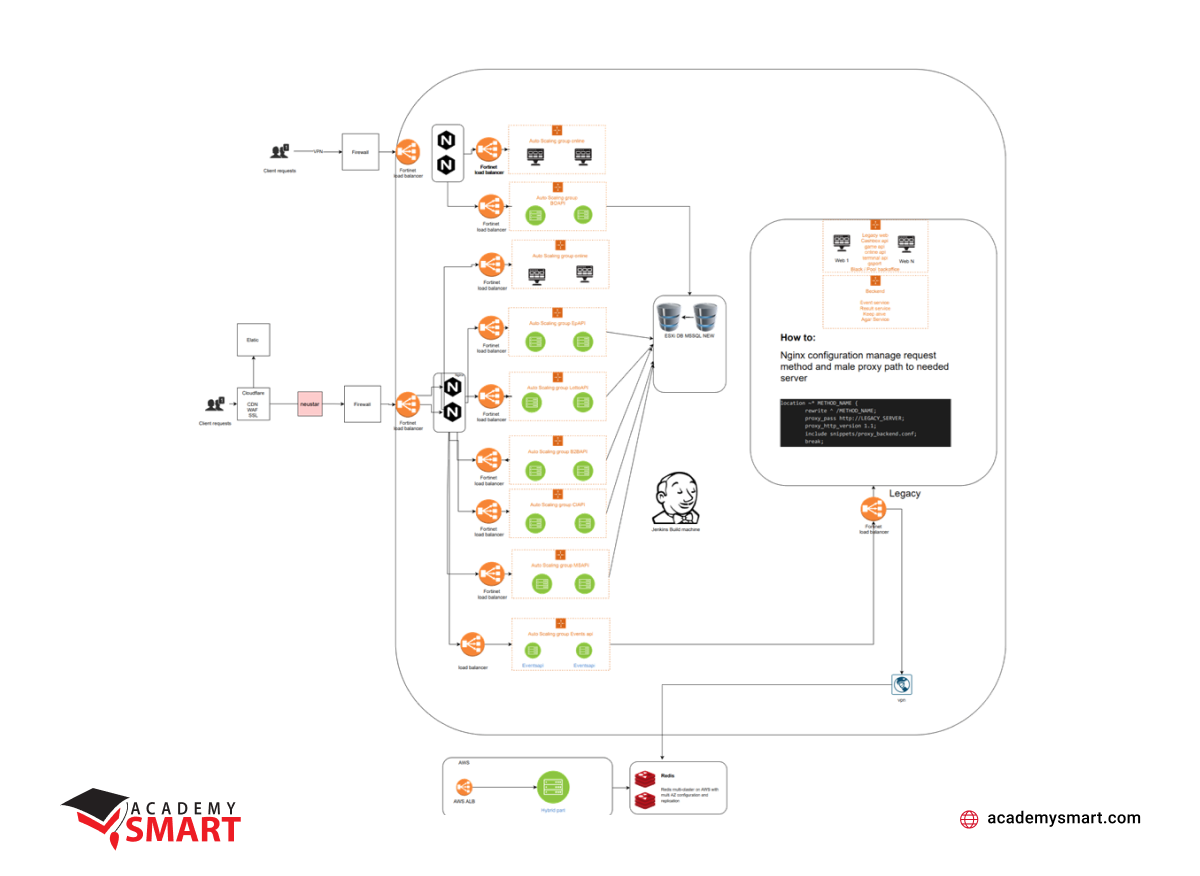
Deployed infrastructure for the first brand
Monitoring became the third significant problem. At the start of the work on the project, we used an excellent tool – Pulseway, which works perfectly with Windows and has a mobile interface through which it is convenient to manage the system and read logs. However, with the move to Linux, this monitoring tool became almost useless due to problems with checking services, and we considered it inappropriate to refine it to the minimum acceptable performance.
As a result, we turned to the proven Prometheus and Grafana tools. But at this stage, we encountered a problem: Cloudflare returns status code 200 even if the website is down due to a status page with an error from Cloudflare. To avoid that, we changed the host files inside the containers to allow communication and interaction between Prometheus and components running through Cloudflare.
The first impression of Grafana statistics wasn’t encouraging either. On the other hand, given the diversity of components and technologies in our infrastructure and solutions that were left from the legacy system, we decided to add some other things to better understand what is going on in our system.
Now, we have supplemented it with the Logzio system based on ELK (Elasticsearch, Logstash, and Kibana) logging system for collecting and analyzing data. And we also actively use Web Application Firewall (WAF) analytics with fine-tuning rate limits from CloudFlare. And in general, this set of tools’ degree of automation and flexibility proved sufficient to ensure the infrastructure’s reliable functioning and timely alerting.
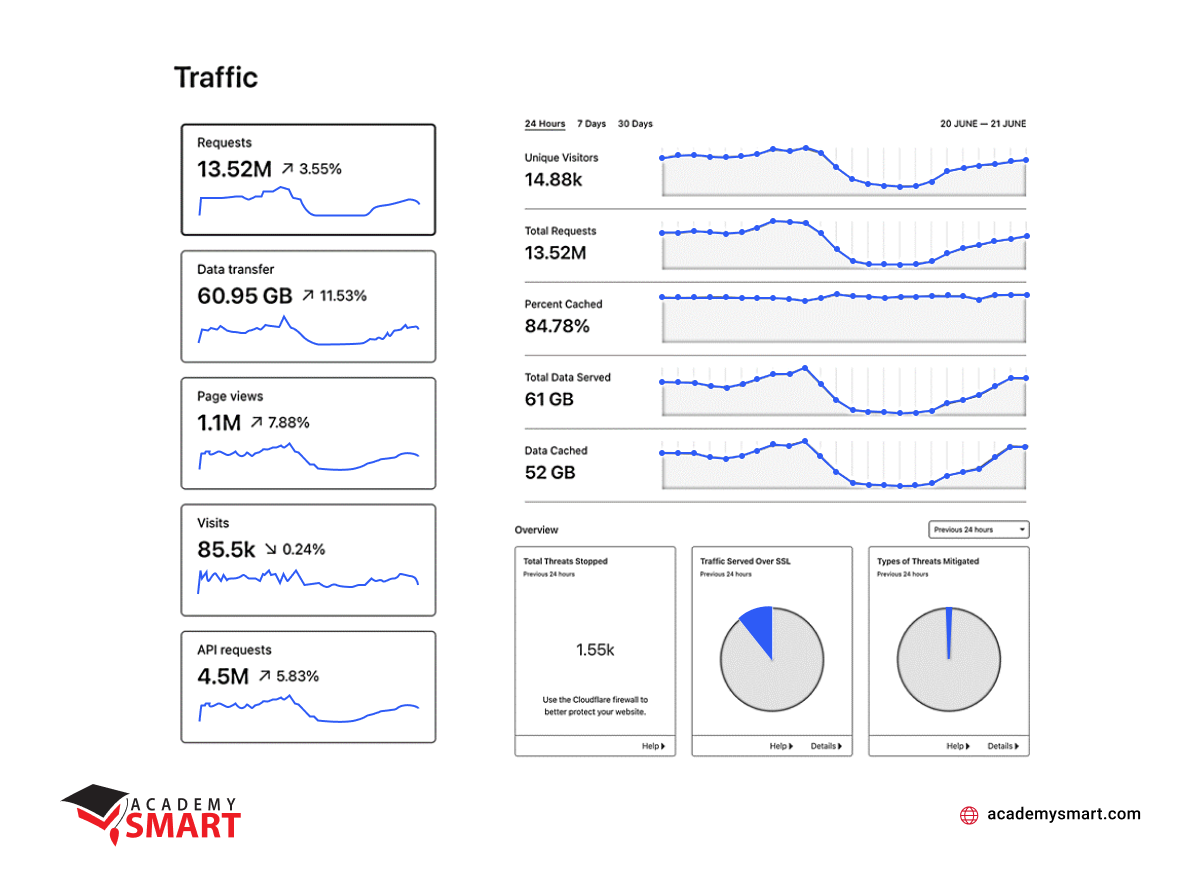
Current monitoring stats in 24 hours
To summarize, at this stage, we have achieved high availability and fault tolerance of the system and excellent scalability and automation of the main processes. On the other hand, we still have increased system complexity and some narrow-profile technical problems in integrating legacy versions of applications.
However, we already have a reasonably clear timeline for migrating services, which takes about two weeks from the developers’ side and a couple of hours from our side of active participation in the deployment. In addition, we have already added eight new services and five servers to the current configuration, and we already have ten brands in production. We are glad that the performance of such a system satisfies our customers, and we have the opportunity to continue the migration processes in the already prepared environment without hindrance.
Book a free consultation

Reach out to start talking today!


